
A Pullback or Something Worse?
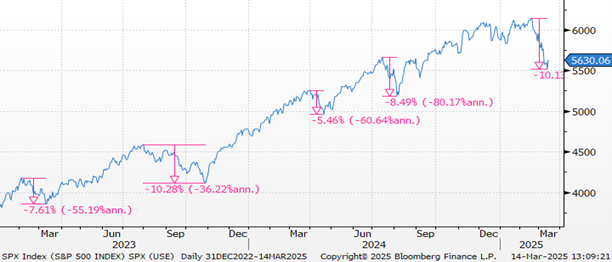
It’s official - investors can officially check the ‘market correction’ box as the S&P 500 Index closed Thursday, March 13, 2025, at 5,521, down 10.1% from its peak on February 19. Year-to-date, the S&P 500 is down just more than 6%. Oddly, it feels a lot worse than that. The stairway up and elevator down behavior of the market has proven accurate once again. The entirety of the 10% correction occurred over just 16 trading sessions.
As investors sometimes do, especially those who monitor their account balances frequently, they tend to measure any decline in portfolio value from the peak. However, investing is not a weekly or monthly endeavor. Markets correct and go down from time to time and portfolio values will fluctuate. For long-term investors, it is vitally important to think about 10- and 20-year time horizons, not 10- and 20-day price changes.
Let’s add some perspective to the idea of markets going up and down. On the wall in my office is a chart that I look at daily. The chart references the stock market “Risk vs. Reward” trade-off. In the most general terms, it shows what investors need to “tolerate” in order to “receive” the long-term average returns for stocks. Dating back to 1926, the S&P 500 has provided positive returns nearly 74% of the time which has equated to an 8% average annual return. Three out of every four years, the S&P 500 sees positive year-over-year returns. By extension, one out of every four years delivers negative returns. This is what an investor can expect being invested in the S&P 500 Index. On the other hand, investors must tolerate (on average) three corrections of 5% per year, one correction of 10% per year, one correction of 15% every three years, and one correction of more than 20% every six years.1
As highlighted in the chart below, over the last few years, we have had several corrections between 5-10% and are now experiencing our second 10% correction in the last 26 months. If we extended the chart to 5-, 10-, or even 20-years, the patterns would show a level of consistency in terms of this behavior.
To some extent, these bouts of volatility are opportunities for each individual investor to learn about their own risk-tolerance and whether they can withstand periodic episodes of price volatility. My colleague, John Traynor, wrote about this topic in his article “Common Sense: Apple and the Oracle of Delphi” in our First Quarter Wealth Outlook.
While nobody can predict the future, the question all investors should ask is: “can I tolerate market corrections of this frequency and magnitude? Further, “what will my reaction be when that inevitable 20% correction arrives?”
Uncertainty Can Be Destabilizing
Without a doubt, these are confusing times for investors. Political uncertainty and a lack of clarity around trade policy is creating a sense of angst amongst investors, businesses (both large and small), and foreign trade partners. This lack of visibility has created greater economic uncertainty and higher market volatility, both of which have manifested in the form of lower stocks prices and declining confidence about the future. Further, the start-and-stop approach around the tariffs and uneven economic messaging continue to add to the market turbulence.
When there is this much uncertainty about the future, corporations tend to hold off from making large capital budgeting decisions and they slow hiring, both of which contribute to and stoke fears of an economic slowdown. Growth is slowing and while many forecasters expected a growth slowdown in 2025, the pace of the slowdown and its causes are different from what was anticipated just a few months back.
Adding to that, the threat of higher tariffs creates the need for real time adjustments by both corporations and investors, as they try to figure out how to adapt to potentially higher costs, supply chain disruptions and shifting consumer demand.
As a result, consumers have become nervous and have been less inclined to stretch to make big purchases, book vacations or spend excessively. The consumer is still reasonably healthy; unemployment is 4.1% (low by historical standards) and wage growth is around the same. However, consumer confidence and consumer sentiment have turned lower. The U.S. economy is a consumption-based economy, and a nervous consumer can have harmful effects on growth and the overall health of the markets.
While the market behavior has been unnerving and there are cracks beginning to show in different pockets of the economy, most of the data remains stable. Key indicators like unemployment claims, corporate profits, and reasonably tight corporate credit spreads indicate that the U.S. economy is not on the verge of recession and the pullback in stocks partially reflects the outlook for slower economic growth.
The biggest concern facing investors would appear to be related to policy uncertainty, which is harder to measure and harder to calculate, but is most likely seen in the consumer confidence and sentiment readings mentioned earlier. The growing fears of higher tariffs and a trade war have combined to increase the odds (albeit modestly) of a policy-induced recession and lower the outlook for growth in the year ahead.
To be clear, we do not believe the economy will go into recession in 2025, but the risks are more elevated, and growth is decelerating. Several Wall Street firms have lowered growth expectations (modestly) for 2025. The Organization for Economic Cooperation and Development (OECD) released its interim economic outlook report where it downgraded its view of global growth this year while also noting that “higher and broader increases in trade barriers would hit growth and add to inflation.” It reduced its U.S. growth forecasts this year from 2.5% to 2.2% and from 2.1% to 1.6% in 2026.2
The animal spirits that drove risk assets higher between the 2024 U.S. election and January 2025 inauguration have been replaced with more guarded skepticism about the role of tariffs, higher trade barriers and mounting geopolitical uncertainty. In our first quarter 2025 outlook, we highlighted heightened global uncertainty and the evolving trade situation as key items to be mindful of. At this point, those issues continue to be the source of key pressure points for investors and are unlikely to disappear in the first half of 2025.
Market prices adjust to new information in “real time,” typically long before the effect of the news shows up in the hard data. For now, markets have begun to reflect increasing economic risks and a lower growth profile ahead. The day-to-day headlines can be unsettling, and the uncertainty is real, but investors have been through equally challenging times in the past. During volatile times like we’re experiencing now, it is important to stay invested, stick with your plan, and avoid emotional decisions. The long-term benefits of holding a well-diversified portfolio of high-quality companies, as well as a complement of fixed income and cash investments will provide a ballast against severe market downturns while adding to portfolio stability. Elections, wars, and economic shocks come and go, but long-term investors always win in the end. History is on our side.
1Source: (“Receive”): Macrotrends.net via Investopedia, (“Tolerate”): RIMES, Standard & Poor’s, (“Batting Average): Forbes, Steve Vernon; all as of 10/29/2021. Fidelity Investments.
2OECD Economic Outlook, Interim Report March 2025, March 17, 2025
Cambridge Trust Wealth Management is a division of Eastern Bank. Views are as of March 2025 and are subject to change based on market conditions and other factors. The opinions expressed herein are those of the author(s), and do not necessarily reflect those of Eastern Bankshares, Inc., Eastern Bank, Cambridge Trust Wealth Management or any affiliated entities. Views and opinions expressed are current as of the date appearing on this material; all views and opinions herein are subject to change without notice based on market conditions and other factors. These views and opinions should not be construed as a recommendation for any specific security or sector. This material is for your private information, and we are not soliciting any action based on it. The charts presented within are for educational purposes only. The information in this report has been obtained from sources believed to be reliable but its accuracy is not guaranteed. There is neither representation nor warranty as to the accuracy of, nor liability for any decisions made based on such information. Past performance does not guarantee future performance.
Investment Products are not insured by the FDIC or any federal government agency, not deposits of or guaranteed by any bank, and may lose value.
Deposit products and related services are offered by Eastern Bank, Member FDIC.