
Success is measured differently depending on your own personal goals, values, and circumstances. A toddler taking his or her first steps. A high school student getting accepted into college. An athlete winning a championship, a golfer shooting par, or a runner finishing a marathon in under 4 hours. In the case of the marathon runner, success could be measured by simply finishing the grueling 26.2 mile race. For runners and investors alike, depending on your expectations, different results can still lead to successful outcomes.
Within the investment world, success has many of the same nuances. A successful year might be measured against whether your portfolio grew enough to cover your distributions, fulfilled your philanthropic goals, helped your children or grandchildren with tuition payments, or simply grew in a way that gets you one step closer to your retirement goals.
Or investment success could be measured more quantifiably. Did my portfolio outperform some comparable benchmark, how did my stocks perform against the S&P 500 Index, or how much risk did the portfolio take to achieve the level of performance? Further, success takes on a different meaning when considering different time perspectives; a goal may not have been achieved this year but the long-term goal is intact.
Investment success can take on many shapes depending on your individual goals, the time horizon on which portfolio decisions are based, and the amount of risk required to earn that return.
2024 Equity Market Review
Domestic stocks
As we reflect on 2024, there is much to appreciate from an investment standpoint. It would be hard to characterize the last two years as anything short of a significant success if you were invested in the domestic stock market. While the S&P 500 Index sputtered across the finish line at the end of December, finishing the month down almost 2.4%, the entirety of 2024 delivered another year of robust returns. In 2024, the market logged 57 new record highs over the course of the year, the sixth most since 1928. The S&P 500 Index provided a total return of 25% or greater for the second consecutive year, and only the fifth time on record that the market has had back-to-back 20%+ gains. Over the prior 24-months, the S&P 500 Index has returned more than 57%; the highest 2-year cumulative return since 1998. As we move down the market capitalization spectrum, returns were solid but not as good as large cap returns. The Russell 2000, a proxy for small-capitalization stocks, increased 11.5%, while the Russell Mid-Cap Index returned more than 15% for the year.
Gains in the United States were broad based with 10 of the 11 economic sectors providing positive total returns and 7 of those sectors posting double-digit growth. The chart below shows the breakdown of total return by sector. Communication Services, Technology, and Consumer Discretionary each outperformed the broader index, increasing between 30% and 40%. Financial stocks surged last year, rising more than 30% helped by the decline in short-term interest rates and a positive inflection in net interest income.
Total Return By Sector in 2024
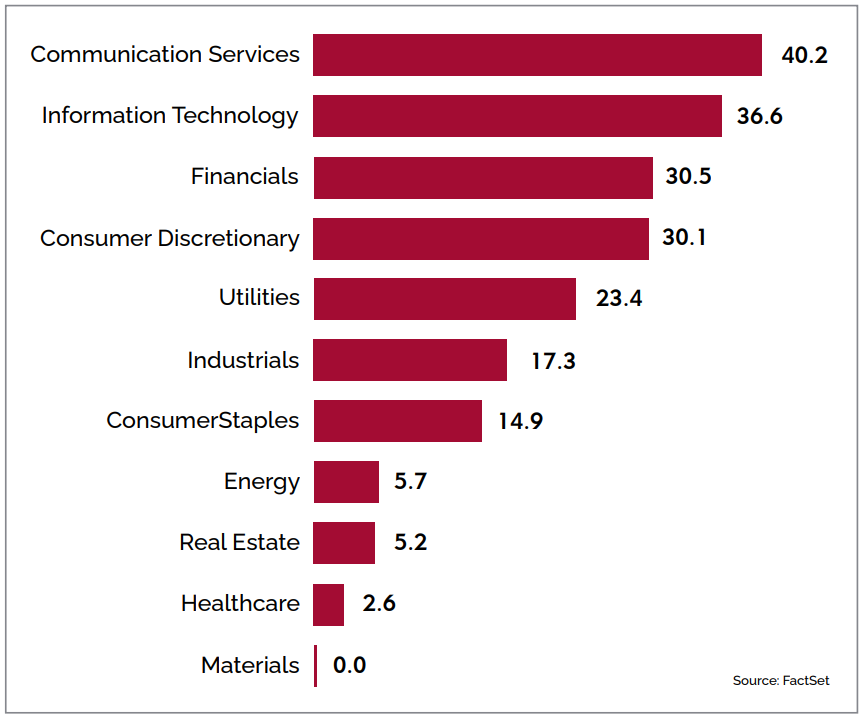
In a replay of last year, returns in the index were top-heavy. The Magnificent 7 stocks (Apple, Amazon, Alphabet, Meta, Microsoft, Nvidia, and Tesla) grew 48% on average, representing more than half of the total return for the S&P 500 Index, while the remaining 493 stocks grew by 10%. Led by Nvidia’s 171% return, the mega-capitalization technology stocks drove growth stocks to outperform value stocks; the Russell 1000 Growth Index increased 33%, while the Russell 1000 Value Index grew 14%.
Reflecting on what success looks like for equity investors, most categories, growth vs. value, large vs. small, performed respectably. If you came into 2024 expecting average stock returns of 8-10%, most equity classes provided that, plus an upside surprise. If you owned a diversified basket of stocks, reflecting a mix of growth and value, large-, mid-, and small-capitalization companies, your portfolio provided solid returns in 2024.
Fixed Income and Interest Rates
The action of the Federal Reserve to raise the Federal Funds rates from 0% to a range of 5.25% to 5.5% created a healthy dose of volatility in bond markets over the last several years. Following a near 45-year bull market for bonds (where yields were down and prices were up), it is likely that bond yields hit a low point in 2021-2022, and a new path higher is emerging. This trend change is likely to ebb and flow over the coming years, but given the levels of federal debt and concerns surrounding the deficit, we expect interest rates to remain elevated for some time.
While higher interest rates are seen as a headwind for equity valuations and the housing market, higher yields now allow fixed income investors to earn positive real returns (yields above the rate of inflation). All-in yields are back to levels last seen nearly 20-years ago, and for the first time in almost 2-years, the yield curve is once again steepening and is no longer inverted.
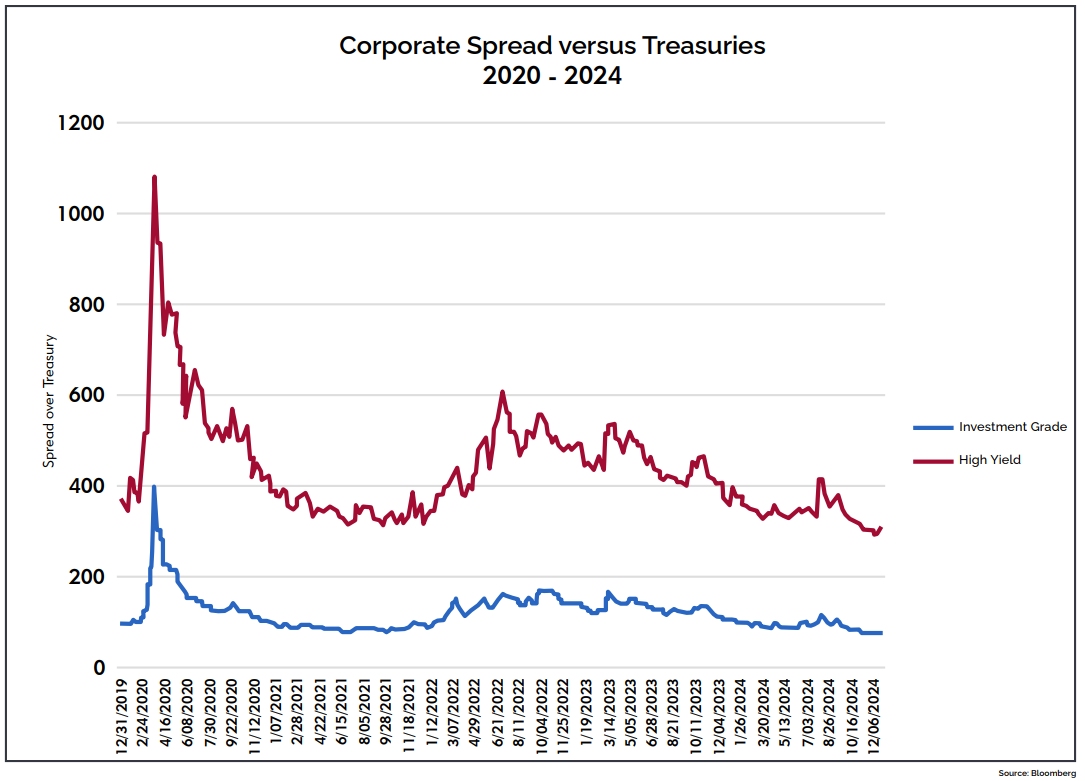
Corporate credit and high-yield bond spreads (spreads representing the incremental yield above the risk-free bond that is required from investors for similar maturity bonds and to compensate for lower credit quality) are near historically tight levels, which typically signifies a level of complacency from the bond market regarding the economic health and investor sentiment towards risk. As we all know, things can change quickly, but for now, stock and bond markets are signaling that the economy is in good shape.
Investment Grade and High-Yield Spreads
Over the last several weeks and months, and following the election of President Trump, longer-term interest rates have moved decisively higher notwithstanding 100 basis points (1.0%) of cuts in the Fed Fund rate (impacting the short end of the interest rate curve). This is partially due to President Trump’s pro-growth agenda and the expectation for better growth in 2025, but also, the potential for higher levels of inflation, and tighter monetary conditions. Higher rates will eventually become a greater headwind for asset prices, but with the 10-year U.S. Treasury still below 5%, the market is taking the rise in rates in stride…at least for now.
International Markets and Foreign Policy
Across the globe, uncertainty remains elevated as investors gauge the evolving U.S trade situation and the status of our ongoing relations with countries around the world. President Trump’s recent comments involving his desire to rename the Gulf of Mexico to the Gulf of America, to acquire Greenland and the Panama Canal, to make Canada the 51st state each add another odd wrinkle to the current state of international affairs.
That said, we were encouraged to see the six-week ceasefire deal between Israel and Hamas go into effect on Sunday, January 19. Hostages have started to be released and humanitarian aid is beginning to flow back into Gaza. The second phase of the ceasefire still needs to be negotiated, and would include the release of the remaining hostages, full withdrawal of Israel from Gaza, and a permanent ceasefire. Less geopolitical turmoil across the world would be a welcomed development.
Over the last few months, and likely tied to President Trump’s pro-growth and domestically focused agenda, we have seen a surge in the value of the dollar and higher interest rates in the United States relative to the rest of the world. The effect of a stronger dollar has benefits for some and disadvantages for others. It allows consumers within the U.S. to purchase foreign goods and services for less than if the dollar was weaker. It also helps to compensate for rising inflation by keeping purchasing power from falling too much. Goods produced in America will be more expensive for foreign buyers, crimping domestic exports. Foreign governments, in particular emerging market economies, that require U.S. dollar reserves, will end up paying relatively more to obtain those dollars.
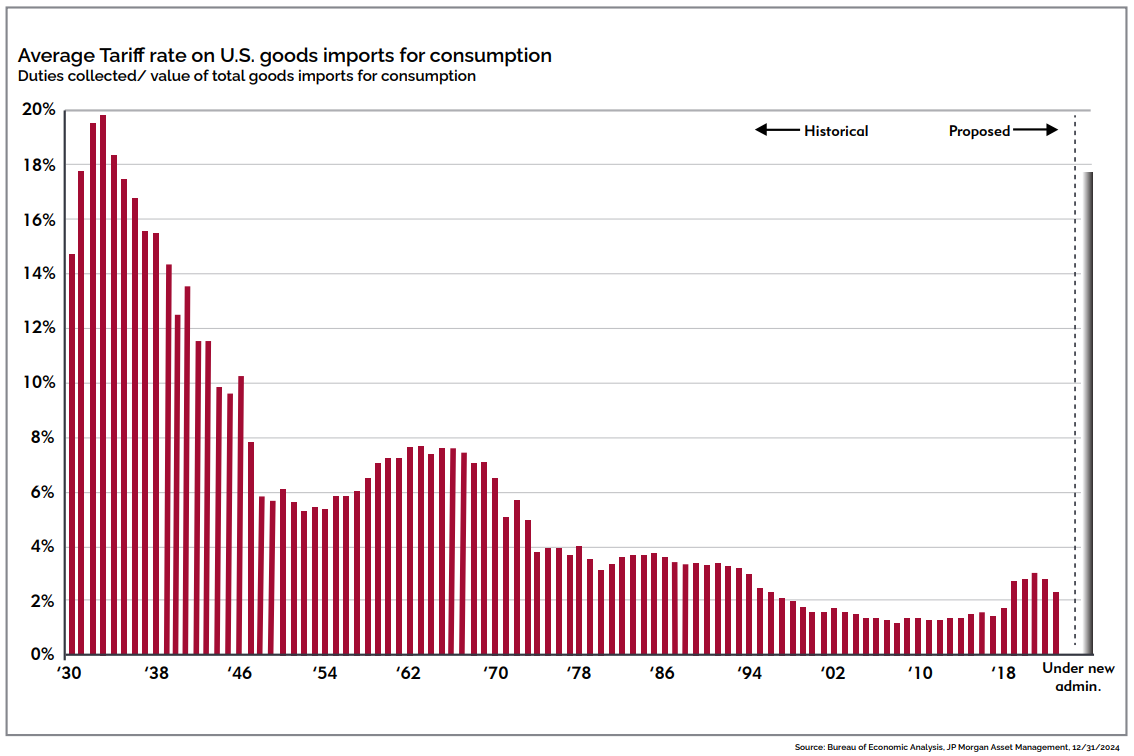
President Trump has talked frequently of imposing tariffs on virtually all our trade partners. While tariffs have been a part of foreign trade policies for over a hundred years, as seen in the chart below, the absolute level of tariff increases being floated by President Trump would be problematic on many levels, bringing us back to levels last experienced in the 1930’s.
A more likely scenario compared to blanket tariffs on all goods would be targeted tariffs, implemented gradually, that apply to every country but only cover a handful of critical imports. This would be a shift from President Trump’s plan during the 2024 presidential campaign but would likely be viewed by markets as a more pragmatic approach to instituting higher tariffs or negotiating for other concessions.
Further, at his confirmation hearing Treasury Secretary nominee Scott Bessent provided a road map for understanding Trump’s trade policies, noting that tariffs will serve three distinct purposes: 1) addressing trade imbalances, 2) raising revenue for the federal budget, and 3) pursuing policy goals, such as more Liquified Natural Gas (LNG) exports, immigration enforcement, and more NATO spending. It would appear, and would be consistent with President Trump’s previous actions, that the threat of blanket tariffs is part of negotiating other concessions from our major trade partners.
There remains great uncertainty around President Trump and the degree to which he will push his agenda forward. Immigration reform, numerous executive orders to undo Biden’s policies, higher tariffs, lower corporate tax rates, and a push towards deglobalization will shape many major economic conversations in the coming weeks, months, and years.
The Economy and Inflation
Despite the uncertainty that comes with a new Administration, the U.S. economy continues to march forward and is showing little sign of slowing. The most recent non-farm payroll report released on January 10, 2025, showed the U.S. economy added 256,000 jobs during the month of December, significantly higher than the consensus of 165,000 that was expected. Despite some modest softening within the manufacturing sector, job gains were solid in virtually all other areas of the economy. A vibrant labor market with an unemployment rate of 4.1% and strong wage growth of 3.9% helps to support ongoing consumer spending trends. The United States is a consumption-based economy, and consumer spending represents nearly 68% of gross domestic product. The health of the consumer is tied closely to employment levels and whether wages are growing faster than the rate of inflation; currently, both employment levels and real wages remain in favorable territory.
As a result of ongoing economic strength, The Federal Reserve is likely to hit pause for an extended period and is unlikely to announce any additional interest rate cuts. Quite frankly, lower interest rates are not needed. For the first time in years, The Fed has dry powder at its disposal should the economy slow meaningfully, or if the job market sees a dramatic slowdown. In either case, we would expect the Fed to cut rates to support the economy. At least for now, the Federal Reserve will continue to monitor its dual mandate of price stability and full employment as both appear to remain in check at the moment.
This chart below details the US Consumer Price Index, excluding Food & Energy, released by the Bureau of Labor Statistics in January and shows inflation in “price” terms over the last 25 years (seasonally adjusted and indexed to 100 in 1982). The gold line shows the trend for consumer price index starting back in 2000. For almost 20-years, the growth in consumer prices was slow and steady, rising gradually each year. Starting in 2021, prices for goods and services surged (red line) and have now reset to a much higher level of prices. While the pace of inflation (2.9%) is slowing, it is doing so from a much higher base.
It is unlikely that consumer prices will fall from these levels, and we are likely in a period of sustained higher prices. However, we were encouraged by the most recent Consumer Price Index (CPI) report for December that showed a deceleration in service inflation, specifically in shelter prices. Housing and shelter costs have been sticky and have caused inflation to remain higher than the Fed’s target. These softening trends are welcomed.
US Consumer Price Index
Predicting the Future is Hard
This is the time of the year when many Wall Street firms look into their crystal ball and try to predict what the market will do in the year ahead. Most times, predicting the short-term performance of the market or any individual stock is an exercise in futility. That said, this is a good time to think about expectations, both our own as well as those of the market forecasters.
Looking back to January of 2024, Wall Street forecasters had very low expectations for the year ahead as many of these prognosticators believed that a recession was imminent. This is important for a few reasons. According to research from Strategas, a sample of 20 Wall Street strategists predicted, on average, a +2% return for the full year in 2024. Some of the best minds on Wall Street provided an average ‘guess’ of 4,867 for the S&P 500 Index for the end of 2024. On the heels of a +25% year in 2023, and with the risk of higher interest rates and stubborn inflation potentially derailing the economy, forecasters were cautious. As of December 31, 2024, the S&P 500 Index finished the year higher by 25% and at a price level of 5,881 - a far cry from the 2% gains many had expected. All of this acts as a reminder that predicting the future is difficult.
So here we are again, at the beginning of a new year with the same group of forecasters (plus a few new ones) setting 2025 year-end targets. After two consecutive years of 25% growth in the S&P 500 Index, recency bias has crept into the minds of the analyst community and strategists are more bullish today than they were at the beginning of last year. As of mid-December, the average Wall Street strategist was forecasting a price target of over 6,513 for the end of 2025. That would represent roughly 11% above the December 31, 2024, close. With market forecasters sanguine about the prospects for 2025 the prevailing feeling across Wall Street is that the good times will continue to roll.
While the election uncertainty has been resolved, policy questions will linger for some time ahead. Much can change throughout the course of a full year, and it is possible that the heightened rhetoric around tariffs was nothing more than negotiating tactics, yet the potential for a greater degree of economic uncertainty and higher volatility does remain elevated.
Despite these considerations, we expect moderating, yet still healthy levels of economic activity in the new year. The economy is on solid footing with GDP growth above trend and consumer spending levels are firm. We believe the job market will remain balanced and the unemployment rate should remain well below long-term averages. Inflation should continue to moderate but will likely remain above the Fed’s long-term target of 2%. Given the most recent job data, it is likely that the Federal Reserve will hold off on any additional rate cuts through the middle of 2025 at the earliest.
For now, we are constructive on equity returns despite elevated valuations. We are bullish on the S&P 500 Index, expecting double-digit earnings-per-share growth in 2025 (and possibly 2026). While interest rates are higher and likely to remain elevated, we do not believe this will derail the economy or markets but may make the path somewhat choppier. The stronger U.S. dollar will benefit domestic companies at the expense of international stocks, and as a result, we remain comfortable being overweight to the United States relative to the rest of the world.
Ryan Hanna
Chief Investment Officer
[email protected]
Common Sense: Apple and the Oracle of Delphi
Located near the crystal-clear waters of the Gulf of Corinth, on the western slope of Mount Parnassus, sits the Temple of Apollo at Delphi. It is the ancient home of the Oracle of Delphi who is thought to have delivered prophecies from the Greek God Apollo. As early as 1400 BC, pilgrims traveled to the Temple seeking wisdom, and enlightenment. Inscribed above the entryway to the Temple are two words imparting what is arguably the greatest wisdom of all “Know Thyself”.
As thoughtful investors, we are constantly seeking the wisdom to make profitable decisions. All too often the one factor standing in the way of our success is ourselves. We imagine ourselves to be cool, rational investors, able to swim against the tide of market irrationality. Our reality is much cloudier, as we are hardwired from our caveman heritage to act first, consider second. Adopting a herd mentality very often kept us alive. When our caveman forebears saw their neighbors run when a lion roared in the distance, they followed. They did not stop to consider whether the lion was interested in them, they just ran. Likewise, panic selling or euphoric buying of a stock because all around us are doing so has proven difficult to resist for as long as markets have existed.
A simple test of your own market fortitude can be had with a review of the trading history of the most valuable company in the world, Apple. Many of us fantasize about investing in the Apple IPO (initial public offering) on December 12th, 1980, and holding the stock to today. A $1,000 investment at the IPO price would today be worth $2,318,400, an annualized return of 19.25% over 44 years. Over those 44 years Apple split its shares 5 times so one share of Apple bought at the IPO is now 224 shares. Chart 1 shows a picture many of us have seen reprinted in newspapers across the country every time Apple’s market value crosses a new trillion-dollar threshold. The parabolic price move it illustrates makes one believe that the rise of Apple’s share price was obvious and inevitable.
The price movement in Chart 2 reveals Apple’s price over the same period, only using a logarithmic scale, where a 10% price move in the early years is equivalent to a 10% move at today’s much higher prices. The striking thing we immediately see on the second chart is that the “inexorable” march higher by Apple has not been as smooth as seen in Chart 1. In fact, there have been four times when Apple’s stock declined by over 70%. On one day, September 29, 2000, its worst single day, Apple declined by over 52%. How would we have reacted to each of these declines if we were that fortunate IPO investor? One telling example is that even Steve Jobs, legendary founder of Apple, sold all his shares in June 1997 at a split adjusted price of .12 cents, just six months before the bottom in December 1997.
How then is a long-term investor to act when faced with tumultuous declines and spectacular rebounds in price? To paraphrase Rudyard Kipling, “How can we keep our heads when all about us are losing theirs?” A few guideposts we try to incorporate into all of our investment decisions have helped block out most of the noise around price swings and helped focus us on the solitude of what is important.
Chart 1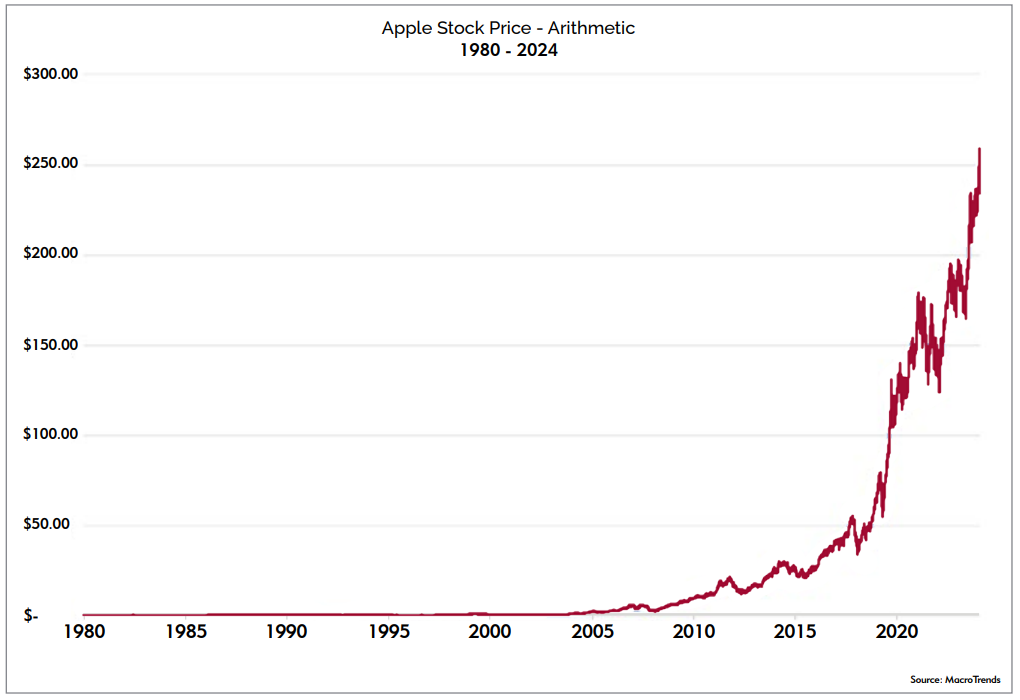
Chart 2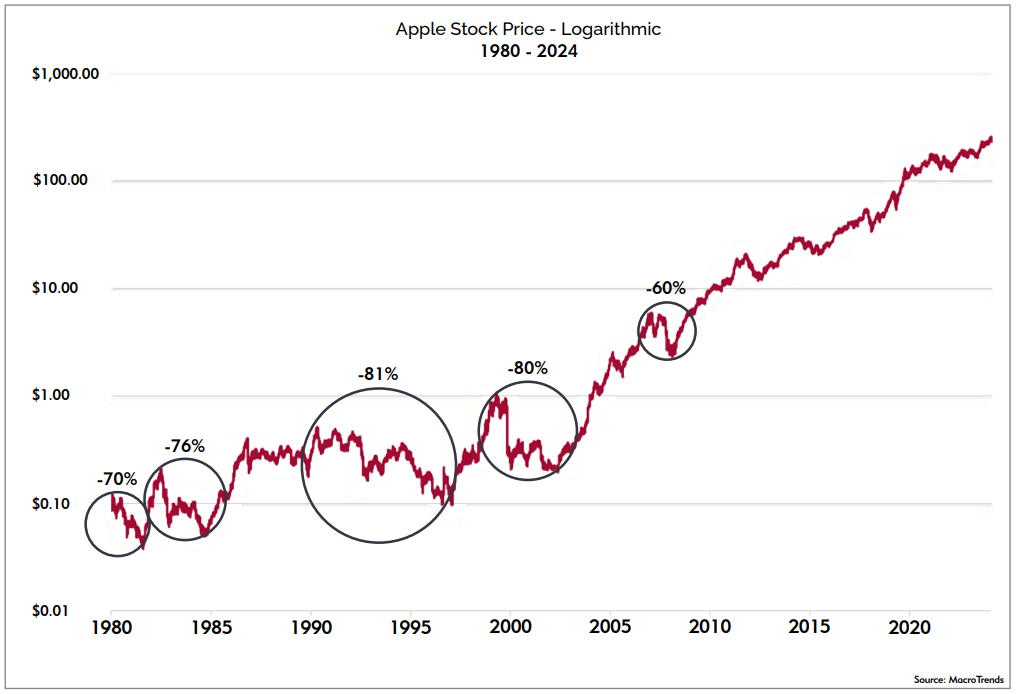
Guide Posts for the Long-Term Investor
“Bull markets are born on pessimism, they grow on skepticism, they mature on optimism, and they die on euphoria.” - Sir John Templeton
As we began this note, we raised the specter of self-knowledge as one of the critical steps a successful investor must take to become a true long-term investor. We do not know how many original Apple IPO investors were able to ride out the ups and downs of Apple’s epic journey, but we do know Steve Jobs was not one of them. He did have the good sense to buy back in once he saw the good fortunes Apple had ahead of it. Ask yourself if you would have been able to hold on to Apple, or if you did sell, would you have bought back in as Steve Jobs did. We believe how each of us answers this question will go a long way to determining our investment success.
John Traynor
President, Cambridge Trust Wealth Management of Connecticut
[email protected]
Cambridge Trust Wealth Management is a division of Eastern Bank. Views are as of February 2025 and are subject to change based on market conditions and other factors. The opinions expressed herein are those of the author(s), and do not necessarily reflect those of Eastern Bankshares, Inc., Eastern Bank, Cambridge Trust Wealth Management or any affiliated entities. Views and opinions expressed are current as of the date appearing on this material; all views and opinions herein are subject to change without notice based on market conditions and other factors. These views and opinions should not be construed as a recommendation for any specific security or sector. This material is for your private information, and we are not soliciting any action based on it. The charts presented within are for educational purposes only. The information in this report has been obtained from sources believed to be reliable but its accuracy is not guaranteed. There is neither representation nor warranty as to the accuracy of, nor liability for any decisions made based on such information. Past performance does not guarantee future performance.
Investment Products are not insured by the FDIC or any federal government agency, not deposits of or guaranteed by any bank, and may lose value.
Deposit products and related services are offered by Eastern Bank, Member FDIC.