This article builds upon a recent piece, COVID Fallout: The Strong Become Stronger written by Scott Smith and expands upon the technology leadership theme.
In 2020, as the Year of COVID-19 continues unabated, investors are trying to understand how stock markets continue to grind higher amidst a global pandemic that has shut down parts of the US and global economies. The reality is, there is a growing dominance by a select handful of stocks: Apple, Amazon, Microsoft, Alphabet (formerly Google) and Facebook. Interestingly, the CEO’s of four of these companies (Apple, Amazon, Facebook and Alphabet) came before Congress just last week to address questions about potentially anticompetitive and monopolistic practices. These five largest US stocks, now account for 22% of S&P 500 market capitalization, up from 16% a year ago. For added context, as of July 19, 2020, the combined market capitalization of Apple, Microsoft, Amazon and Google was larger than the entire Japanese stock market.
Through mid-July, collectively the “Big 5” have returned 35% YTD, compared with a decline of -5% for the remaining 495 S&P 500 stocks, resulting in an S&P 500 return of around 2%.
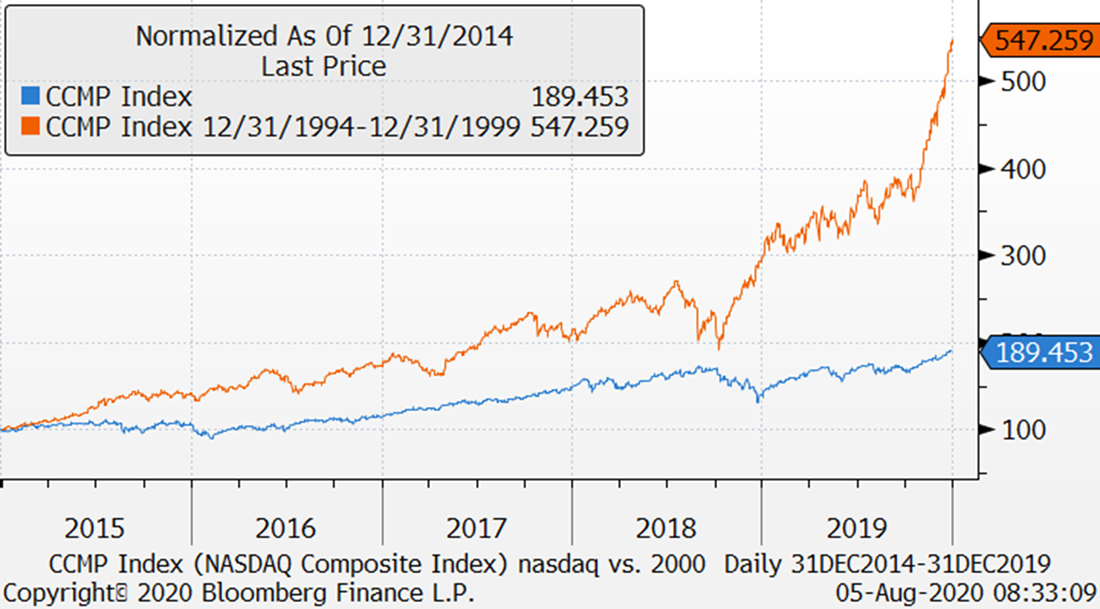
The chart below shows the Nasdaq Index performance, a good proxy for technology-related companies, over two distinct time periods. The orange line shows Nasdaq price performance for the 5-year period of 1995-1999, representing a 447% cumulative increase over the 5-years leading up to the “Tech Bubble”, or roughly 40% per annum. The blue line shows Nasdaq price performance from 2015-2019, rising by a paltry 89% cumulatively, or 13.6% annually. For another added comparison, the S&P500 was up roughly 9.5% annually over the last five-year period. That performance discrepancy, 13.6% vs. 9.5%, hardly screams “Bubble."
Another difference between the 1990’s and our current period is the drastically different monetary policy in place. In 2000, the Federal Reserve was tightening monetary policy, with its benchmark interest rates rising to 6.5%. Currently, the central bank has cut rates to near zero and intends to keep rates suppressed for an extended period to combat the effects of the virus on the US economy.
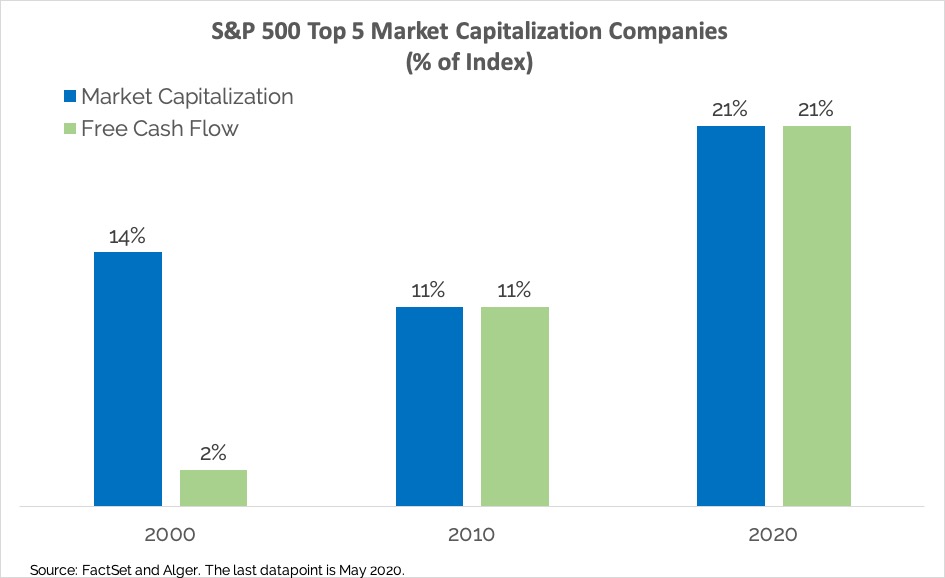
Finally, back in 2000, a significant number of technology companies were barely profitable or even unprofitable. In fact, in 2000, the top five companies in size represented 14% if the market capitalization of the S&P 500, yet only produced 2% of the free cash flow of the index. As of May 2020, the top 5 companies represent 21% of the market capitalization and a corresponding 21% of the free cash flow[1]. Technology companies have come a long way since the Dot.Com bubble.
Admittedly, despite the three differences noted above, there are visible risks that need to be acknowledged. As mentioned earlier, regulatory risk appears to be growing for some of the larger technology companies and that is likely to remain an overhang for some time. The broader group is also well-loved by investors and generally considered “crowded” trades, which adds concentration risk and being too aligned with the herd. Another knock on technology stocks, represented by the Nasdaq Composite Index, would be extreme valuations. The price-to-earnings ratio for the Nasdaq Composite Index, on forward 12-month estimated earnings, (Bloomberg) is almost 39x, the highest since 2001 (forward P/E ratio for the Nasdaq in 2001 was over 72x). Finally, the performance of growth stocks relative to value stocks recently surpassed extreme levels last seen in 2000, so it is not altogether surprising to hear comparisons to the go-go years of the past.
Over the past twenty years, the technology sector has evolved and matured from the days of the Dot.Com era. Today’s technology sector is generally more reflective of increased demand for its "essential" services, strong balance sheets, superior profitability, and consistent free cash flow generation, vastly different characteristics when compared to the super-speculative technology sector in 2000. As our country remains in a continued state of partial shutdown, how essential is our Wi-Fi, mobile network, and broadband connections? How could we connect with schools, co-workers, clients, friends, and families without Zoom, Microsoft Teams, Facebook, Apple’s FaceTime, emails, and texts? As a result, we have seen strong stock returns driven by the performance of a rather narrow group of secular leaders and growth compounders.
While growth in many of these areas may remain strong for years to come, we must ask ourselves, is all this good news already reflected in current price levels? Last week, Amazon reported second quarter revenue that increased 40% compared to last year (benefitting massively from COVID) and earnings growth of 90%. Similarly, on Friday, Apple’s stock price rose 10% and Facebook’s stock increased more than 8% following much better than expected earnings reports.
A reasonable skeptic might ask, how much better can things get for these companies, or are they priced to perfection? Fair questions to consider. We are not blind to the fact that technology stocks cannot (or will not) go down; they most certainly can (and will) at some point. Presently, valuations are likely stretched in the short-term, but for the long-term investor that alone is not a reason to sell. Perversely, if the US does undergo a COVID second wave, and children are required to learn remotely, businesses continue to work-from-home, to the extent possible, and people remain hesitant to shop, travel or gather, it is quite likely that the demand trends experienced over the past five months will remain elevated, and the winners are likely to continue to win and grow further. On the other hand, if/when a vaccine is approved, and proves effective, a rotation back towards the laggards and out-of-favor cyclical stocks, and out of the "work-from-home" winners may very well materialize in terms of stock market price action. However, technology is getting ever more rooted in our world and will be a long-term compounding investment into the future with prudent portfolio risk management and rebalancing along the way.
[1] “Is Too Much Concentration Bad?” Alger, May 2020
Size Matters
For casual followers of the stock market, domestic investors tend to focus on three broad indices to gauge stock market performance. The Dow Jones Industrial Average, a price-weighted group of 30 large companies is likely the most quoted index of the three, yet tends to be an inadequate representation of the broader US stock market. In this index, the stock with the highest dollar price has the most impact on daily price changes in this index. The S&P 500, a market capitalization-based index, is less quoted though still very popular, yet is a more accurate reflection of the US stock market. Its performance is driven by how well the largest companies in the index do and tends to be very "top-heavy." Finally, the Nasdaq Composite Index, another market capitalization-based index, is comprised of a group of nearly 2500 companies, and tends to lean more towards technology and growth stocks when compared to the other two indexes. For the S&P and Nasdaq, the size of their largest members is the dominating factor in how those indices perform.In 2020, as the Year of COVID-19 continues unabated, investors are trying to understand how stock markets continue to grind higher amidst a global pandemic that has shut down parts of the US and global economies. The reality is, there is a growing dominance by a select handful of stocks: Apple, Amazon, Microsoft, Alphabet (formerly Google) and Facebook. Interestingly, the CEO’s of four of these companies (Apple, Amazon, Facebook and Alphabet) came before Congress just last week to address questions about potentially anticompetitive and monopolistic practices. These five largest US stocks, now account for 22% of S&P 500 market capitalization, up from 16% a year ago. For added context, as of July 19, 2020, the combined market capitalization of Apple, Microsoft, Amazon and Google was larger than the entire Japanese stock market.
Through mid-July, collectively the “Big 5” have returned 35% YTD, compared with a decline of -5% for the remaining 495 S&P 500 stocks, resulting in an S&P 500 return of around 2%.
Is This the Dot.Com Bubble All Over Again?
As discussed, leadership and performance across the S&P 500 has been concentrated to a smaller group of very large companies, most of them technology related. Given the strong performance of technology stocks, and given the growing concentration of "big" companies at the top, comparisons of the current stock market to the stock market in the late 1990's and the infamous tech bubble are starting to surface on a more regular basis. While some similarities exist, there are also three main differences.The chart below shows the Nasdaq Index performance, a good proxy for technology-related companies, over two distinct time periods. The orange line shows Nasdaq price performance for the 5-year period of 1995-1999, representing a 447% cumulative increase over the 5-years leading up to the “Tech Bubble”, or roughly 40% per annum. The blue line shows Nasdaq price performance from 2015-2019, rising by a paltry 89% cumulatively, or 13.6% annually. For another added comparison, the S&P500 was up roughly 9.5% annually over the last five-year period. That performance discrepancy, 13.6% vs. 9.5%, hardly screams “Bubble."
Another difference between the 1990’s and our current period is the drastically different monetary policy in place. In 2000, the Federal Reserve was tightening monetary policy, with its benchmark interest rates rising to 6.5%. Currently, the central bank has cut rates to near zero and intends to keep rates suppressed for an extended period to combat the effects of the virus on the US economy.
Finally, back in 2000, a significant number of technology companies were barely profitable or even unprofitable. In fact, in 2000, the top five companies in size represented 14% if the market capitalization of the S&P 500, yet only produced 2% of the free cash flow of the index. As of May 2020, the top 5 companies represent 21% of the market capitalization and a corresponding 21% of the free cash flow[1]. Technology companies have come a long way since the Dot.Com bubble.
Market Capitalization is Increasingly Concentrated, But So Is Free Cash Flow
Admittedly, despite the three differences noted above, there are visible risks that need to be acknowledged. As mentioned earlier, regulatory risk appears to be growing for some of the larger technology companies and that is likely to remain an overhang for some time. The broader group is also well-loved by investors and generally considered “crowded” trades, which adds concentration risk and being too aligned with the herd. Another knock on technology stocks, represented by the Nasdaq Composite Index, would be extreme valuations. The price-to-earnings ratio for the Nasdaq Composite Index, on forward 12-month estimated earnings, (Bloomberg) is almost 39x, the highest since 2001 (forward P/E ratio for the Nasdaq in 2001 was over 72x). Finally, the performance of growth stocks relative to value stocks recently surpassed extreme levels last seen in 2000, so it is not altogether surprising to hear comparisons to the go-go years of the past.
Should I Stay or Should I Go?
Over the past twenty years, the technology sector has evolved and matured from the days of the Dot.Com era. Today’s technology sector is generally more reflective of increased demand for its "essential" services, strong balance sheets, superior profitability, and consistent free cash flow generation, vastly different characteristics when compared to the super-speculative technology sector in 2000. As our country remains in a continued state of partial shutdown, how essential is our Wi-Fi, mobile network, and broadband connections? How could we connect with schools, co-workers, clients, friends, and families without Zoom, Microsoft Teams, Facebook, Apple’s FaceTime, emails, and texts? As a result, we have seen strong stock returns driven by the performance of a rather narrow group of secular leaders and growth compounders.While growth in many of these areas may remain strong for years to come, we must ask ourselves, is all this good news already reflected in current price levels? Last week, Amazon reported second quarter revenue that increased 40% compared to last year (benefitting massively from COVID) and earnings growth of 90%. Similarly, on Friday, Apple’s stock price rose 10% and Facebook’s stock increased more than 8% following much better than expected earnings reports.
A reasonable skeptic might ask, how much better can things get for these companies, or are they priced to perfection? Fair questions to consider. We are not blind to the fact that technology stocks cannot (or will not) go down; they most certainly can (and will) at some point. Presently, valuations are likely stretched in the short-term, but for the long-term investor that alone is not a reason to sell. Perversely, if the US does undergo a COVID second wave, and children are required to learn remotely, businesses continue to work-from-home, to the extent possible, and people remain hesitant to shop, travel or gather, it is quite likely that the demand trends experienced over the past five months will remain elevated, and the winners are likely to continue to win and grow further. On the other hand, if/when a vaccine is approved, and proves effective, a rotation back towards the laggards and out-of-favor cyclical stocks, and out of the "work-from-home" winners may very well materialize in terms of stock market price action. However, technology is getting ever more rooted in our world and will be a long-term compounding investment into the future with prudent portfolio risk management and rebalancing along the way.
[1] “Is Too Much Concentration Bad?” Alger, May 2020