
So far, 2025 has seen tremendous interest rate movement. The uncertainty surrounding tariffs and the potential impact to both inflation and growth has led to heightened levels of rate volatility. The 10-year U.S. Treasury began the year yielding 4.57%, rising to 4.80% by the middle of January, and then subsequently declining to 4.15% in early March. After the President announced his administrations tariff policy on April 2nd, the 10-year U.S. Treasury initially declined to 4%. It has since seen its yield steadily increase to 4.5% on the potential of higher prices and the uncertainty caused by tariffs could weigh on household and business spending creating a headwind to economic growth which could lead to further interest rate volatility. At the March Federal Open Market Committee (FOMC) meeting, Federal Reserve Chair Jerome Powell indicated that tariffs have already begun to impact the economy and were factored into the committee’s economic projections. The much-anticipated Summary of Economic Projections (SEP), commonly referred to as the dot plots showed downward revisions to growth forecasts and upward revisions to inflation and unemployment projections.
The Fixed Income team reviews several market metrics related to interest rates, most notably the shape of the U.S. Treasury yield curve between the 2- and 10-year maturities. As of April 28, 2025, the 2-year U.S. Treasury Note yields 3.79%, while the 10-year U.S. Treasury Note yields 4.29%. The front-end of the yield curve (U.S. Treasury Bills) is flat, indicating no yield differential between the 1-month and 6-month. The implied Fed Funds rate to 2-year U.S. Treasury is inverted by 70 basis points, implying further rate cuts. Currently, the Fed futures market expects an additional 100 basis points of reductions by the end of this year. This suggests the market is more concerned that the negative impact to growth from tariffs will overwhelm the impact of higher inflation.
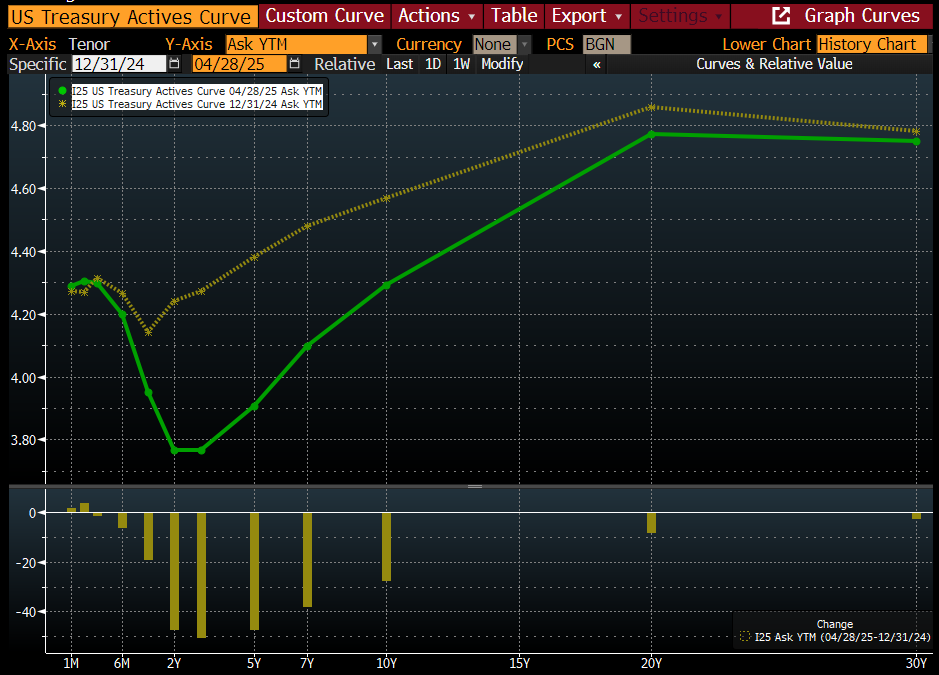
Source: Bloomberg L.P. April 14, 2025. US Treasury Actives Curve. Retrieved from Bloomberg database.
Years of quantitative easing by the Fed may also play a role in the inversion as the market deciphers the "real" level of yields. The 10-year U.S. Treasury yield has traded in a range of 3.60% to 4.80% for the past 12 months. These yields are low by historical standards but compared to recent history, they are elevated.
Credit spreads, the incremental yield pickup investors earn for owning a corporate bond versus the corresponding U.S. Treasury are an indicator of economic health and investor sentiment. Today, credit spreads have widened since the tariff announcement but are not a level indicating stress in the corporate bond market. Corporations did a tremendous job in terming out their debt with record low interest rates and are not facing any immediate refinancing risks. Financial credit metrics, like interest coverage ratios, remain strong, and there has not been a meaningful increase in leverage.
The Federal Reserve has a dual mandate of maximum employment and stable prices. Inflation remains above the Fed's target, but considerable progress has been made towards lowering inflation. Wage growth is still strong, and the unemployment rate is 4.1%. The last mile is the most challenging fight on the inflation front. The Fed is searching for a neutral interest rate that neither constricts economic growth nor stimulates it. According to their most recent dot plot, they anticipate a neutral rate close to 3% in the long run. As the chart below illustrates, current inflation break-evens point to the market expecting inflation to average 2.3% to 2.4% over the next 10 years. However, 2-year break-even rates (orange line) have substantially increased since the election, reflecting the view of higher short-term inflation from the impact of tariffs. The Fed will weigh the risk of overstimulating the economy by reducing interest rates too quickly and a decoupling of inflation expectations. This could lead to a Fed that will err on the side of caution and delay further reducing interest rates. The Fed is aware that the second wave of inflation has more significant consequences for the overall economy.
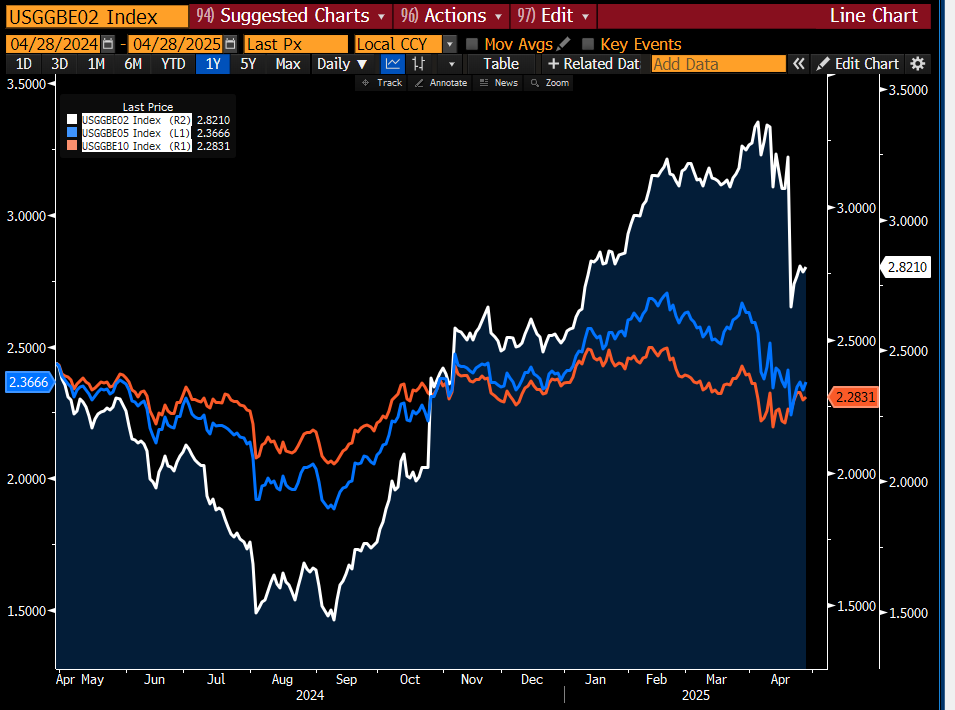
Source: Bloomberg L.P. April 14, 2025. US Breakeven Inflation Data. Retrieved from Bloomberg database.
Fiscal and monetary policy might be misaligned. As the Fed intends to lower rates via monetary policy, the U.S. government is increasing the budget deficit, which stands at $1.6 trillion. Under existing tax and spending laws, the Congressional Budget Office has estimated that deficits will average 6% of GDP over the next 10 years. Bond vigilantes, circa 1980's, may roar back to life. The U.S. government currently has over $33 trillion in outstanding debt, with interest outlays to service that debt exceeding the military budget. Although the U.S. is still considered one of the safest investments, budget deficits may cause investors to demand higher interest rates, creating competing forces against each other as the Fed moves to lower rates. As a result, longer-term maturity yields may increase and create a further steepening of the yield curve as investors demand more yield for longer bond maturities.
What does all this mean for the outlook on interest rates? Currently, we anticipate rates to stay higher for longer but are not likely to test the 6% yields we saw in 2000. The Fed futures market, which has a low correlation to actual rates, expects up to 100 basis point cuts for the balance of 2025. Rate cuts could be accelerated if inflation reverts to the Fed's 2% target more quickly or the economy shows worrisome signs of slowing. We are also monitoring the potential of inflation increasing, which could cause the Fed to reverse course and raise interest rates. Either way, it is hard to envision a scenario that will lead to the low interest rates of the past decade. Longer-term maturity yields (greater than 5 years) are more reflective of the level of inflation and GDP growth. Investors have been afforded the greatest opportunity to lock in these highest yields since 2000, and holding bonds to maturity implies the forward return of purchasing the 10-year U.S. Treasury at over 4%.
Cambridge Trust Wealth Management is a division of Eastern Bank. Views are as of April 2025 and are subject to change based on market conditions and other factors. The opinions expressed herein are those of the author(s), and do not necessarily reflect those of Eastern Bankshares, Inc., Eastern Bank, Cambridge Trust Wealth Management or any affiliated entities. Views and opinions expressed are current as of the date appearing on this material; all views and opinions herein are subject to change without notice based on market conditions and other factors. These views and opinions should not be construed as a recommendation for any specific security or sector. This material is for your private information, and we are not soliciting any action based on it. The charts presented within are for educational purposes only. The information in this report has been obtained from sources believed to be reliable but its accuracy is not guaranteed. There is neither representation nor warranty as to the accuracy of, nor liability for any decisions made based on such information. Past performance does not guarantee future performance.
Investment Products are not insured by the FDIC or any federal government agency, not deposits of or guaranteed by any bank, and may lose value.
Deposit products and related services are offered by Eastern Bank, Member FDIC. Residential lending is provided by Eastern Bank, an Equal Housing Lender.