
Economic conditions remain generally solid yet have favorably softened from their most frothy points and have thereby raised the odds that a “goldilocks” soft landing might be achieved, and a recession avoided. However, certain data in labor and housing remains stubbornly stronger-than-ideal for the Fed’s inflationary goals. There are also still ongoing “slow burn” challenges beneath the surface such as the stresses in commercial real estate. The banking sector also remains under pressure from higher rates and the inverted yield curve. Combining these slow burn factors with other “flare up” risks such as Ukraine escalation, turbulent weather (ongoing heat plus hurricane season underway) and the possibility of a US government budget shutdown later this year, we are not out of the woods yet in terms of risks to the inflation and growth outlook.
Given outlook and current valuations, our baseline recommends a small underweight to equities, neutral (market weight) in fixed income and a small overweight to cash as dry powder for new opportunities while earning relatively attractive short-term yields in the interim. Portfolios captured a lot of the market rally, and our equity team is now finding interesting profit taking and relative value swap opportunities. (We do temper some of this activity in taxable portfolios with capital gains budget limitations). Current secular themes in our equity models include generative AI, cyber security, cloud computing, automation/digitization and electrification/clean energy transition. We also have been finding interesting opportunities in healthcare and industrials.
.
Bond markets were down slightly in Q2 and only the higher yielding segments finding much upside with emerging markets debt, high yield and bank loans up 1.6-3.2%. Bond markets completed the first half up 1-2% for intermediate maturity high grade bonds and up 4-6% for higher yielding segments of credit. Cash earned 1% in Q2 to arrive at 2+% for the first half, with another reliable 2-3% to come in the second half consistent with its approximately 5% annualized yield. While these returns pale in comparison to equities, an allocation to bonds and cash remains an appropriate income source that provides reliable ballast and diversification for portfolios over the long term.
As this letter went to print, the Federal Reserve raised rates yet again but appears to be near the end of its hiking cycle which should be net supportive to bond markets. Consistent with the evolving rates outlook, we slightly increased the duration of our bond models in recent trading.
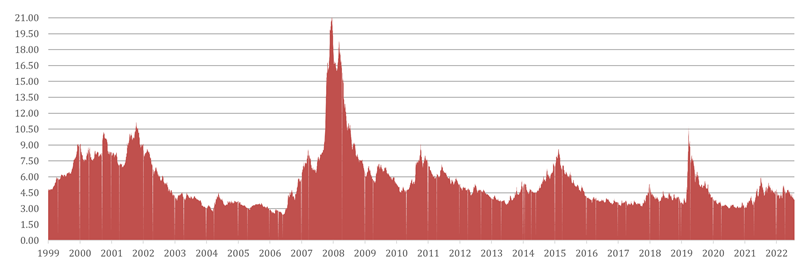
The macroeconomic nervousness embodied by the inverted US Treasury yield curve shape is not evident in credit spreads at all. Corporate debt spreads remain tight and without fear of any immediate or widespread credit risk, as shown in the graph below. Many companies wisely cleaned up balance sheets, extended debt maturities and/or generally deleveraged during the era of near-zero interest rates. There is also a growing amount of capital available in private credit markets as a possible lifeline for those in more unique or precarious financing positions. We have limited exposure in lower rated credit and are waiting for better entry opportunities.
US High Yield Index Spread: % additional yield above Treasuries
12/31/1999-7/25/2023, ICE BofA Option-Adjusted Spread
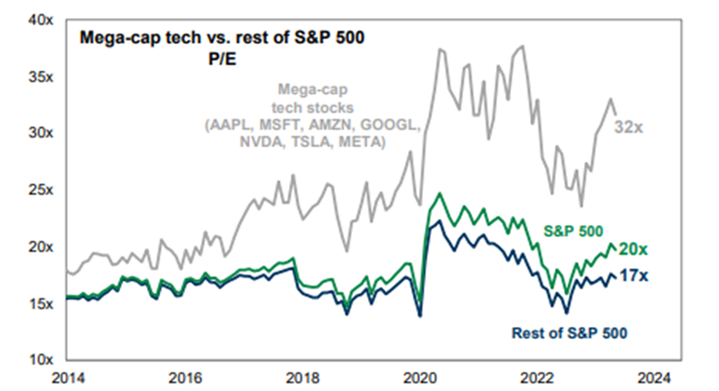
The market turned in a remarkably strong first half. We are comfortable with client positions in that portfolios captured a nice portion of the upside without chasing overvalued stocks or bonds that would be inconsistent with our quality, fundamental valuation approach. While the stock market could avoid a major selloff, it will be difficult to find another leg up as dominant as the first half. The risk/return setup is less attractive from these levels.
We are happy with the success of many of positions and expect to be long-term holders of many important secular themes that have led this rally. However, active management can contribute incremental value in markets like these. We continue to rotate portfolios according to relative value and changes in risk/return relationships within and across asset classes. Portfolios will be able to add to exposures on weakness, and we are patiently waiting for better entry points in some of our favorite equity and credit picks.