Economy & Markets
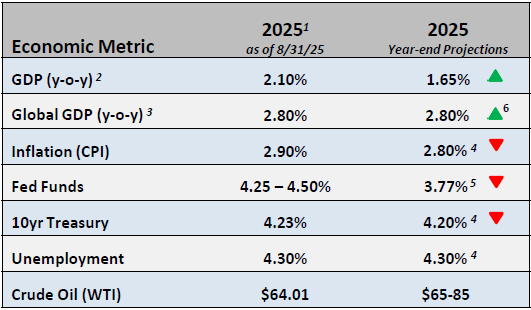
- The economy grew at a revised 3.3% in the second quarter, up from -0.5% in the first. As we have discussed in the past, trade and inventory management have both distorted the true strength in the economy. Backing those two factors out, real final sales to domestic purchasers, a great indicator of underlying economic strength, grew at 1.9% in the first half of the year.
- The higher growth in the second quarter was due primarily to increased consumer spending and larger capital expenditures by businesses, specifically in the technology sector. We expect growth in the 1.5% range for the remainder of 2025.
Equities
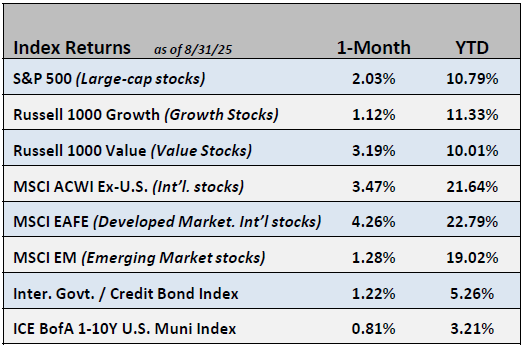
- In August, the S&P 500 rose by +2.0%, led by the Basic Materials and Healthcare sectors, bringing its year-to-date return to +10.8%. In a reversal from the last few months, value stocks outperformed growth stocks in August. Shares of international companies outpaced their domestic counterparts, although both delivered strong absolute returns.
- S&P 500 earnings estimates revisions moved decidedly higher. The outlook for profit growth remains strong, with expectations of +10.5% in 2025 and approximately +13% annually in 2026 and 2027. Valuation is rich with the S&P 500’s forward P/E multiple up to 22.3x, an elevated level relative to historical averages.
Fixed Income
- Bond yields rallied on the news from the Fed’s Jackson Hole symposium that cuts are coming. The 2-year Treasury declined 34 basis points while the 10-year Treasury declined 15 basis points.
- Credit spreads widened to 80 basis points on the mix of stubborn inflation and a weakening labor market.
Employment
- The August unemployment rate rose to 4.3% from 4.2% in July. In 2025, the economy added 74,000 private sector jobs per month. Of those jobs, roughly 64,000 per month have been in the health services sector, showing slower growth for the rest of the economy.
- Further compounding the reality of a slowing labor market, the job growth data reported for the period from early 2024 to early 2025 was revised down by 911,000 jobs. This is the largest annual revision since 2000.
Federal Reserve
- The September Fed meeting resulted in a 25-basis point cut. The Fed is concerned by the slowing employment market while also watching inflation remaining stubbornly above its 2.0% target rate.
- Consumer prices rose by 2.9% over the last 12 months according to the August CPI. The core rate, excluding food and energy, rose by 3.1% over the same period, which while still elevated was not as high as feared.
Issues to Watch
- Trade negotiations could be complicated even more by legal challenges to the Trump administration’s tariffs. The Supreme Court will review and weigh in on whether the President has overstepped his executive powers.
- Economic protests are rising in Europe, most recently in France, which illustrates the difficulties governments are having with growing budget deficits and rising defense expenditures.

1 Data provided by Bloomberg. Metrics are as of month-end or most recent publication
2 Provided by U.S. Real GDP Economic Forecast Survey Median
3 Provided by World Real GDP Economic Forecast Survey Median
4 Provided by Bloomberg Intelligence Forecast
5 Provided by World Probability Forecast
6 Arrows represent a month-over-month change

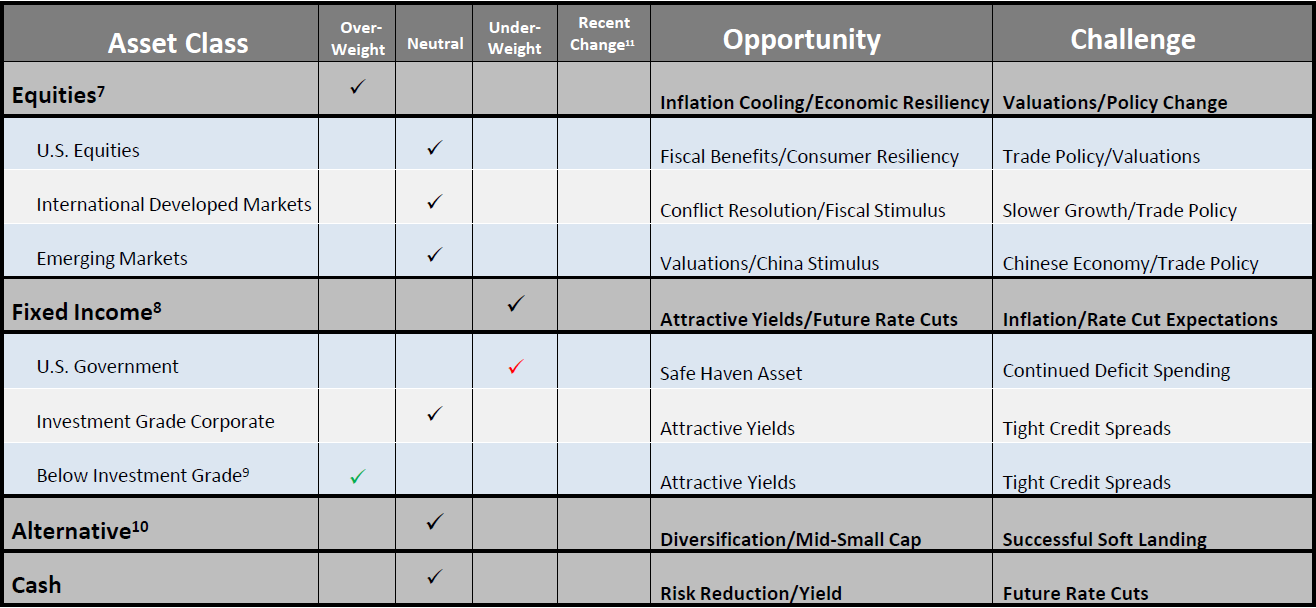
Asset Allocation / Tactical Positioning - September 2025

7Equity tactical weights are relative to the Cambridge Trust Wealth Management Core Equity allocation and is comprised of 80% S&P 500 and 20% MSCI AC World ex-U.S. Index.
8Fixed Income tactical weights are relative to the Cambridge Trust Wealth Management Core Taxable allocation and is comprised of 100% Barclays Intermediate Gov/Credit Index.
9Below investment grade holdings include high yield and emerging market debt mutual funds. Represents an out-of-benchmark allocation that will be reflected as an overweight position relative to the Barclays Intermediate Gov/Credit Index if any allocation is held.
10Alternative tactical weights represent an out-of-benchmark allocation that will be reflected as an overweight position when utilized and neutral position when not.
11Direction arrow highlights any recent changes of the overall allocation after a recent tactical asset allocation or strategy change. Last changes were made at July 2025 Asset Allocation Committee meeting.
Cambridge Trust Wealth Management is a division of Eastern Bank. Views are as of September 2025 and are subject to change based on market conditions and other factors. The opinions expressed herein are those of the author(s), and do not necessarily reflect those of Eastern Bankshares, Inc., Eastern Bank, or any affiliated entities. Views and opinions expressed are current as of the date appearing on this material; all views and opinions herein are subject to change without notice based on market conditions and other factors. These views and opinions should not be construed as a recommendation for any specific security or sector. This material is for your private information, and we are not soliciting any action based on it. The information in this report has been obtained from sources believed to be reliable, but its accuracy is not guaranteed. There is neither representation nor warranty as to the accuracy of, nor liability for any decisions made based on such information. Past performance does not guarantee future performance.
Investment advisory services and investment products are not insured by the FDIC or any federal government agency, not deposits of or guaranteed by any bank, and may lose value.
Deposit products and related services are offered by Eastern Bank, Member FDIC.
