
A Quick Reflection
One of the most consistent themes this year is that change comes quickly. Since January, I’ve written numerous market recaps and recorded a handful of videos. The number of ‘draft changes’ and ‘rewrites’ seems to reflect the recurring theme that a single comment or social post can change the narrative and the direction of markets. Trade wars, tariffs, peace deals, government shutdowns, and the lack of current economic data have kept us on our toes as investors.
With that said, as we assess the current market environment, it’s worth revisiting a timeless truth: fundamentals and corporate earnings remain the primary drivers of stock market performance. As we reflect on the first three-quarters of 2025 - and despite persistent headlines around geopolitical tensions, inflation fears, and policy uncertainty - the data has painted a constructive picture.
Performance Summary
Domestic stocks rebounded in the third quarter with the S&P 500 increasing 8%, which brought full year gains to 14.8% through September 30. For the full year, international stocks have outperformed domestic equities, supported by a weaker U.S. dollar relative to most foreign currencies and more attractive valuations.
Developed markets as measured by MSCI EAFE Index were up more than 24%, with industrial and financial sectors outperforming, supported by increased NATO defense spending and two European Central Bank (ECB) rate cuts. The MSCI Japan Index advanced more than 19%, as well, with equities in the world’s 4th largest economy benefitting from corporate governance reforms and domestic reflation. Emerging markets also increased substantially during the first nine months, growing by more than 26%. Post-election stability helped push the Korean market upward, China saw more modest gains amid ongoing stimulus efforts, while Latin America and Southeast Asia also booked gains. A weaker U.S. dollar and easing trade tensions supported capital flows into these regions.
As we approach the end of October, the S&P 500 and the Nasdaq are poised to continue their winning streaks of 5 consecutive months of positive stock market returns dating back to April. Following the market low on April 8th through October 29th, the Nasdaq Composite increased almost 57%, and the S&P 500 rose by more than 38% and has recorded more than 32 new record highs in 2025. Looking back three years, the S&P 500 has returned an incredible 94% cumulatively, or 24% on an annualized basis.
While gains continue to be ‘top heavy’ behind ongoing strength in technology and communication services, it is encouraging to see signs of improving breadth across the market that includes participation from the financial, industrial, and utility sectors. Further, the equal-weighted S&P 500 is on the verge of breaking out to all-time highs, as well. While absolute returns might vary by stock or sector, broader market participation is a welcomed sight for investors.
Nonetheless, market leadership remains heavily concentrated in companies linked to Artificial Intelligence (or, AI); Nvidia just surpassed $5 trillion in market capitalization, while Apple and Microsoft are hovering near $4 trillion. These are astonishing numbers.
The Economic “Glass”: Half Empty or Half Full?
Let’s begin with the caveat that we have gotten limited economic data since the government shutdown began on October 1. However, leading up to the shutdown, the U.S. economy continued to defy pessimistic sentiment. Second-quarter GDP rose at a revised annual rate of 3.8%,1 with real final demand up 1.9% in the first half, reflecting the actual strength in the economy. Underlying demand has remained resilient despite the economic turmoil this year.
The U.S. Census Bureau reported that August adjusted retail sales remain robust, rising 0.6% compared to July, and 5% relative to August 2024.2
The labor market, while slowing, remains historically tight with the unemployment rate at 4.3% and wages growing at 3.9%, well above the pace of inflation. The government shutdown has delayed the September employment report, but we do have data from ADP that affirmed the slow jobs data. ADP reported a loss of 32,000 private sector jobs in September,3 the largest decline in over 2 years. It is more likely than not that the unemployment rate will continue to creep higher given the confluence of tighter immigration policies, an aging demographic, and the emergence of Artificial Intelligence but that is unlikely to derail an otherwise good economy.
Additionally, we fully expect that when the government does reopen, there will be a surprise or two as the October and November data starts to flow and we get a more up-to-date view of the U.S. macroeconomic situation.
Despite the government shutdown, on Friday October 24, we finally received a government data point: the consumer price index (CPI). Inflation levels remain elevated and above long-term targets with Core CPI at 3.0% on a year-over-year basis. Yet, with inflation expectations still looking anchored at closer to 2.5% (2-year breakeven inflation),4 we are not overly worried about runaway inflation despite lingering tariff effects.
In the short-term, strong secular trends around AI and data center capital spending, combined with the fiscal benefits from the One Big Beautiful Bill Act (OBBBA) and a handful of anticipated rate cuts from the Federal Reserve have provided the bulls with sufficient ammunition to drive stock prices higher. Further, corporate profitability continues to trend higher adding another tailwind to equity prices.
Longer-term, increasing debt levels and a rising deficit, the potential for an elongated period of sticky prices (i.e. inflation), market concentration, high valuations, credit risks and an increasingly stretched lower-end consumer, provides the bears with enough to be concerned about.
The U.S. economy resembles a dynamic storyline: uncertain direction, twists and turns, and characters under intense scrutiny. A government shutdown, slowing job growth, ongoing tariff and trade debates, and heightened consumer uncertainty are creating a precarious narrative, whereby the resolution depends on more stability from all three branches of government, fiscal policy decisions, and Fed actions. In this sense, the plot continues to unfold.
As discussed, the most recent ‘plot twist’ has been the U.S. government shutdown. Historically speaking, government shutdowns have proven to be merely a hiccup for the stock market. Going back to 1976, there have been a total of 22 government shutdowns lasting an average of 8 days. The last shutdown in 2019 during President Trump’s first term was only a ‘partial shutdown’ and lasted a total of 34 days (the longest of the 21 previous shutdowns). At this point, we do not expect any lasting economic impact from the shutdown. Yet, as we move into the 5th week of the shutdown, it is fair to say that the longer this situation drags on, the greater the possibility that something goes wrong. According to research by Strategas, the rate of real GDP growth has been positive in the last six shutdowns and 11 of the past 12.5 The market has and should continue to look through the government shutdown as it awaits an eventual reopening, but this remains an ongoing risk.
By no means should we ignore the shutdown. The lack of visibility into the job numbers, housing data, and economic growth (GDP) add elements of uncertainty. Even viewed through alternative methods, we can see that consumer confidence is falling, the labor market is balanced with narrow gains (both hiring and firing have stalled), stagnation is evident, and lower-income consumers are struggling. Businesses, consumers, and workers are under stress, and their decisions to spend, save, or invest, will help shape the outlook in the coming months and years. The upper-end consumer has carried the weight of spending for some time and continues to do so, while lower-end consumers remain under pressure. A material uptick in layoffs is another red flag that would shift the narrative meaningfully and is something we are watching closely.
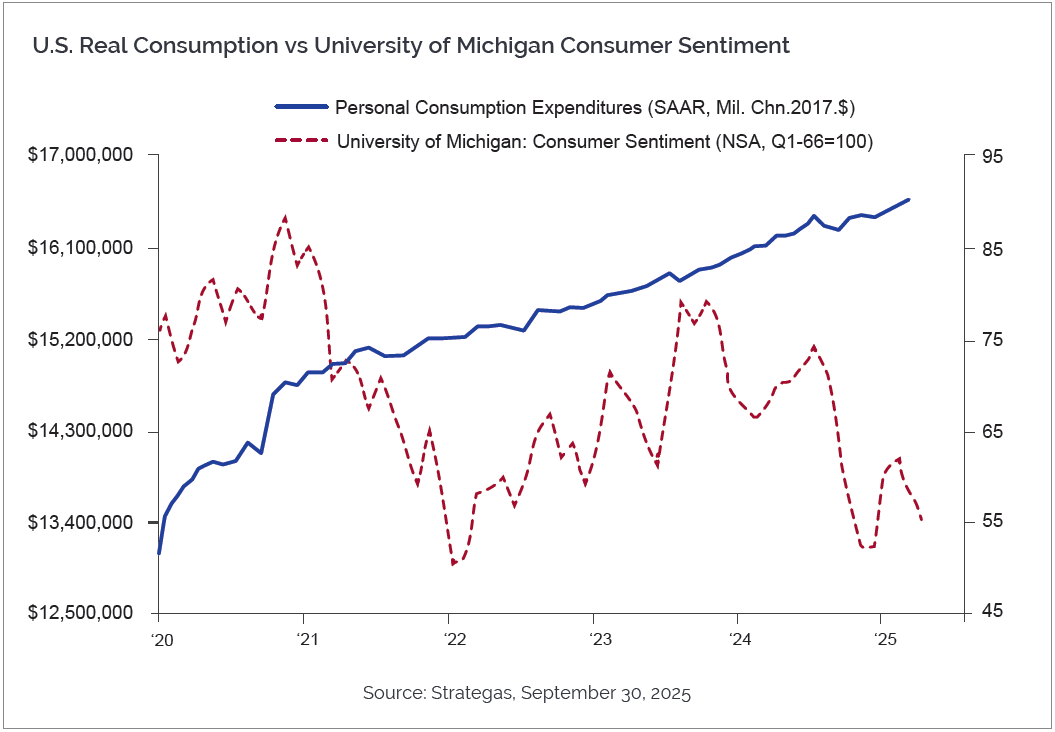
Interestingly, real consumption continues to grow, even as sentiment declines. The chart below shows that while consumer confidence (University of Michigan Sentiment Index) is near five-year lows, spending remains resilient – highlighting the disconnect between perception and behavior.
Whether you lean bullish or bearish, a relatively convincing case can be made for either scenario given a myriad of factors. Currently, our team views the economy’s glass as ‘half full’ and we expect continued momentum in economic growth, corporate earnings, and stock prices into 2026.
To Cut or Not to Cut?
After three years of strong stock performance and two years of solid GDP growth, The Federal Reserve has begun to shift its policy stance. With 25-basis point rate cuts at both the September and October Federal Open Market Committee (FOMC) meeting, the Fed has signaled a pivot – placing greater emphasis on labor market softness over inflation concerns.
The shift raises an important question: If the economy is performing well, are additional rate cuts necessary – or even beneficial – and what impact would cuts have on markets?
Pros of Lower Interest Rates
- Stimulate borrowing and investment: lower rates can reduce the cost of capital, encouraging businesses to invest and consumers to borrow for homes, cars, and other big-ticket items.
- Supports asset prices: equities and real estate often benefit from lower discount rates, which can boost valuations and investor sentiment.
- Eases debt burden: Corporate, consumer, and government debt become more manageable, potentially reducing default risks and improving balance sheets.
- Boosts employment: easier financial conditions can lead to job creation, especially in interest rate sensitive sectors like housing and manufacturing.
Cons of Lower Interest Rates
- Inflation risk: prolonged low rates can stoke inflation, especially if demand outpaces supply or if fiscal stimulus remains elevated.
- Asset bubbles: cheap money can lead to speculative excesses and risk taking, particularly in equities, crypto, and real estate.
- Reduced policy flexibility: cutting rates now leaves less room for future stimulus if economic conditions deteriorate.
- Pressure on savers: lower yields hurt savers, and the interest earned on deposits.
The Fed’s current approach reflects a delicate balancing act – supporting growth and employment while remaining vigilant about inflation and financial stability. With inflation expectations still anchored and the labor market showing signs of softening, the case for moderate rate cuts is defensible. However, the long-term implications of sustained low rates warrant close attention.
Conclusion
With the S&P 500 approaching 7,000, we are looking at another year of strong stock market gains; markets continue to reward strong fundamentals and resilient corporate profitability. While risks are numerous—from policy uncertainty to consumer fragility —the macro backdrop supports a cautiously optimistic outlook. Our positioning throughout the past year (a modest overweight to stocks) reflects this view, yet with an emphasis on diversification, quality, and global exposure. We have been managing risk in the portfolios by reducing our best-performing technology stocks on the margin and redeploying cash in some beaten down areas with attractive valuations, such as healthcare and international markets.
We encourage you to stay focused on the data and remain open to the opportunities it presents. If you're leaning bearish, be mindful: the current environment favors patience and pragmatism over pessimism.
As always, we welcome the opportunity to review your portfolio and discuss how your investment strategy aligns with the evolving economic landscape. Please don’t hesitate to reach out to schedule a conversation with your Portfolio Manager, Relationship Manager, or Wealth Advisor.
1 Bureau of Economic Analysis, September 25, 2025
2 U.S. Census Bureau, Advanced Monthly Sales for Retail and Food Services, September 16, 2025
3 ADP National Employment Report, Change in U.S. private employment, October 1, 2025
4 Bloomberg, USGGBE02, October 16, 2025
5 Strategas, Daniel Clifton, “1st Government Shutdown Since 2019 Started This Morning”, October 1, 2025
Cambridge Trust Wealth Management is a division of Eastern Bank. Views are as of November 2025 and are subject to change based on market conditions and other factors. The opinions expressed herein are those of the author(s), and do not necessarily reflect those of Eastern Bankshares, Inc., Eastern Bank, or any affiliated entities. Views and opinions expressed are current as of the date appearing on this material; all views and opinions herein are subject to change without notice based on market conditions and other factors. These views and opinions should not be construed as a recommendation for any specific security or sector. This material is for your private information, and we are not soliciting any action based on it. The charts presented within are for educational purposes only. The information in this report has been obtained from sources believed to be reliable but its accuracy is not guaranteed. There is neither representation nor warranty as to the accuracy of, nor liability for any decisions made based on such information. Past performance does not guarantee future performance.
Investment Products are not insured by the FDIC or any federal government agency, not deposits of or guaranteed by any bank and may lose value.
Deposit products and related services are offered by Eastern Bank, Member FDIC.