
On February 19th, the S&P 500 Index reached an all-time high of 6,144 and investors were feeling sanguine about the state of the U.S. economy. Unemployment was low, wages were growing, inflation was stable, and the ‘hard’ economic data was solid despite some emerging cracks in consumer sentiment and confidence. In fact, animal spirits were running high and expectations that moderating, yet healthy, economic growth would continue was the market consensus.
In our March publication we posed the question “A pullback or something worse?” and talked about uncertainty and lack of clarity around trade policies, while also noting the speed of the 10% market correction which occurred over only sixteen trading sessions in February and March. After a moderate rebound, stocks declined 10% over two days last week wiping out more than $5 trillion in stock values. The plunge in stock prices has left investors rattled and shaken. Tariff certainty arrived with a sledgehammer.
Wednesday April 2, 2025, was coined “Liberation Day” in the United States by President Trump. Personally, I was attending a Macroeconomic Conference in New York City that day and the tone from the speakers, the panels, and many people I spoke with was cautious but not overly worried.
At 4 pm that afternoon, President Donald Trump announced a comprehensive tariff plan aimed at addressing trade imbalances and bolstering domestic manufacturing. This plan introduced a baseline 10% tariff on most imported goods, with significantly higher rates for specific countries: 46% on imports from Vietnam, 34% on Chinese goods (in addition to an existing 20% tariff), 20% on products from the European Union, and 24% on Japanese imports. The Administration framed these measures as steps toward achieving “fair and reciprocal trade” and revitalizing American industry.
Prior to President Trump’s announcement on Wednesday, there was a growing sense that this announcement might be a clearing event for the markets; something that would signal the worst was behind the market and provide clarity on the path forward. Those investors and corporations that were waiting to deploy capital into projects would now have a better sense of the future operating environment.
Suffice to say, and relative to what investors were expecting, the President’s reciprocal tariff proposal was the worst effective outcome and financial markets responded swiftly and negatively to the announcement. On Thursday and Friday, the S&P 500 experienced sharp declines of 4.8% and 6%, respectively, marking the worst two-day performance since early 2020. The Nasdaq Composite dropped by 5.8% and 6%, and the Dow Jones Industrial Average plunged 4% and 5.5%, respectively. The market declines were attributed to investor concerns over the growing possibility of a global trade war, the increasing likelihood for a global economic slowdown, and growing possibility of an economic recession.
Extreme Levels of Volatility and Uncertainty
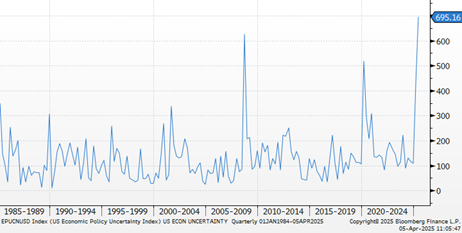
The uncertainty that President Trump has caused through his often-changing trade policies has raised concerns around economic growth, inflation, and the likelihood of further retaliatory tariffs. Further, the confusion caused by the on again-off again tariffs is roiling both domestic and international business confidence. The chart below displays the heightened levels of US Economic Policy Uncertainty. The index has surged since January and now sits at a point well above levels last seen during the Great Financial Crisis in 2008 and the COVID-19 pandemic in 2020. The widespread skepticism surrounding President Trump, and his economic policies is reflected across the broader economic landscape and directly on stock prices. Thus far, the President has remained steadfast and resolute in his posture towards the tariff plan and looks unlikely to walk back his policies in any meaningful way. While we may be approaching ‘peak’ tariff uncertainty, volatility in markets is likely to remain for quite some time.
If there is a silver-lining, elevated levels of economic uncertainty have historically represented a good opportunity to begin inching back into the market. If investors were buying stocks in early 2009 or at the peak of COVID uncertainty in 2020 during the previous spikes around policy uncertainty, investors were rewarded handsomely in the forward years. Studies show that when the U.S. Economic Policy Uncertainty Index is above 180 (currently at 695), forward 12-month returns for the S&P 500 have averaged more than 21%. 1
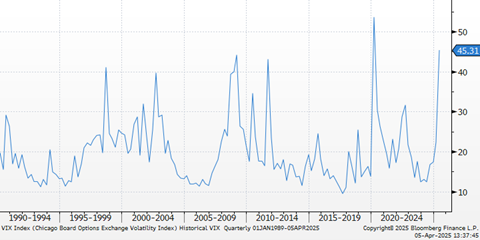
Further, the Chicago Board Options Exchange Volatility Index (VIX) increased on Friday by more than 50% to 45.3. These levels of volatility, either in stock prices, interest rates, or across the policy spectrum, all provide insight into the emotional state of investors today and how extreme the last few days have been on the markets psyche. However, like extremes in the policy index, adding to stocks when the volatility index is above 40, has also proved to be prudent strategy for long-term investors.
Tariffs/Taxes
In response to the U.S. tariffs, China imposed a 34% tariff on all U.S. imports, intensifying fears of a full-scale trade war. This retaliatory action contributed to further market instability and heightened concerns about a potential recession. Many Wall Street firms have subsequently increased their assessments of the probability of a U.S. recession within the year citing the disruptive economic effects of the new tariffs. JP Morgan’s chief economist Bruce Kasman described the tariffs as a “functional tax increase” that could lead to the most significant tax hike since World War II.
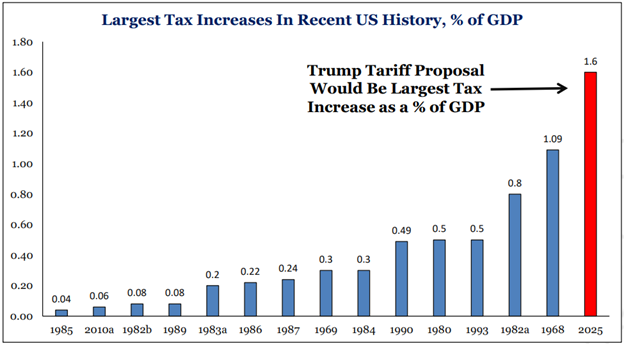
Dan Clifton, a Washington D.C. Policy expert at Strategas Research Partners, opined that the tariff rate will jump 10-fold from 2% to over 20% if the proposal is implemented in full. There is no tax increase in modern history that even comes close to what this tariff increase represents. The estimated $620 billion of estimated annual tariffs, represents nearly 2% of Gross Domestic Product (GDP), and would represent almost $100 billion MORE than what the government collects in corporate income taxes during a given year. The size and scale of the tariff proposal is unprecedented.
Domestically, the tariffs faced criticism from various sectors. The National Retail Federation warned that the tariffs would “cause more anxiety and uncertainty for American businesses and consumers,” emphasizing that U.S. importers, not foreign suppliers, would bear the initial financial burden. The National Association of Manufacturers expressed concern that the tariffs would threaten jobs, supply chains, and investment, potentially undermining America’s manufacturing competitiveness. A broader concern amidst this level of uncertainty is that businesses and consumers will pull back spending plans and take a “wait and see” approach, further exacerbating the slowdown in U.S. economic growth and corporate profitability.
Interest Rates
In terms of interest rates and the bond market, we have seen a flight to quality and demand for U.S. Treasuries has increased driving prices for bonds higher and yields lower. Yields on 2-year and 10-year U.S. Treasuries have collapsed as investors begin to price in a higher probability of rate cuts by the Federal Reserve, and as investors become more cautious on the outlook for economic growth.
After touching 5% in April of 2024, 2-year US Treasury rates are now down to 3.65%. The ‘Fed-put’, meaning the expectation that the Federal Reserve will intervene to support markets if prices fall too quickly, acting as a safety net for investors, has gotten more attention lately and is something that could help prop up falling stock prices. However, during an interview on Friday, Federal Reserve Chairman Jerome Powell indicated that he would not rush to offset the impact of Trump’s tariffs because the economy is still in a good place, while also acknowledging higher uncertainty and growing downside risks. Fed Fund rate cuts remain a potential positive catalyst at some point but are unlikely to occur in the short-term.
10-year US Treasury Yields (Blue) & 2-year US Treasury Yields (Orange)
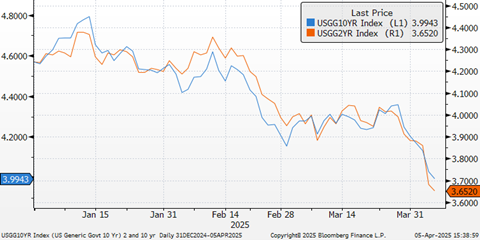
The yield on 10-year U.S. Treasuries has also declined significantly this year. On January 14, 2025, yields were 4.8% and today those yields are just under 4%. Lowering interest rates was a stated goal of the Administration with the hope that lower yields would stimulate the housing market with decreased mortgage rates. Another potential benefit of lower long-term interest rates would be reduced borrowing costs, allowing the government to extend and term-out debt at significantly lower cost as the Administration looks to extend key provisions within the Tax Cuts and Jobs Act (TCJA) that is set to expire on December 31, 2025.
Are There Upside Risks?
People are aware of the downside risks; they have been telegraphed on every news channel and publication since Wednesday afternoon and many of them are real. However, this self-induced policy crisis comes at a point when the economy itself was reasonably healthy. Robust demand by consumers ahead of the tariff policy should translate into solid first quarter economic data, and at this point there has not been any significant impact on the job market despite the shrinking government workforce. Friday’s payroll report showed healthy growth in nonfarm payrolls and an expanding labor force participation rate. While most of this data is backwards looking, the economy was in reasonably good shape.
As discussed earlier in the piece, we have seen extreme levels of volatility and policy uncertainty, and we might be approaching peak levels for each. History has shown that adding to risk assets at these extremes can be lucrative, but admittedly, there could be more downside before things settle down. Patience is required.
Also as discussed earlier, the “Fed put” may be put into action at some point to help support the economy as growth expectations slow.
It is likely that the tariff proposals that were introduced last week represent the ceiling and any change in tariffs is likely to move down from here, not up. If the two trading days after the announcement represent the worst and greatest degree of ‘pain’ (and that remains to be seen) it is quite possible that news on the tariff front could get better from here. Policymakers on both sides, domestically and internationally, should be highly incentivized to negotiate improvements to avoid a global recession.
While the tariffs are in effect a fiscal tool that act like a ‘tax’, it is quite possible that income tax cuts could be significant, as well, especially for the lower- and middle-income classes. The Administration may try to accelerate relief to Americans in this form, potentially helping to offset a portion of the tariff pain.
What to Do
President Trump’s tariff plan introduced significant import taxes aimed at addressing trade imbalances and promoting domestic manufacturing. The immediate market reaction was overwhelmingly negative, with substantial declines in major indices and heightened fears of a global recession. The tariffs prompted retaliatory measures from key trading partners, further exacerbating market instability and economic uncertainty. While some investors maintained a degree of optimism about the long-term prospects of the U.S. market, the prevailing sentiment was one of caution amid escalating trade tensions and potential economic downturn.
Without a doubt, these are unsettling times for global investors, and it is quite possible that we have not seen the end of market volatility. Whatever the end game is, investors and businesses will adjust and adapt to the new operating environment, but that will take time.
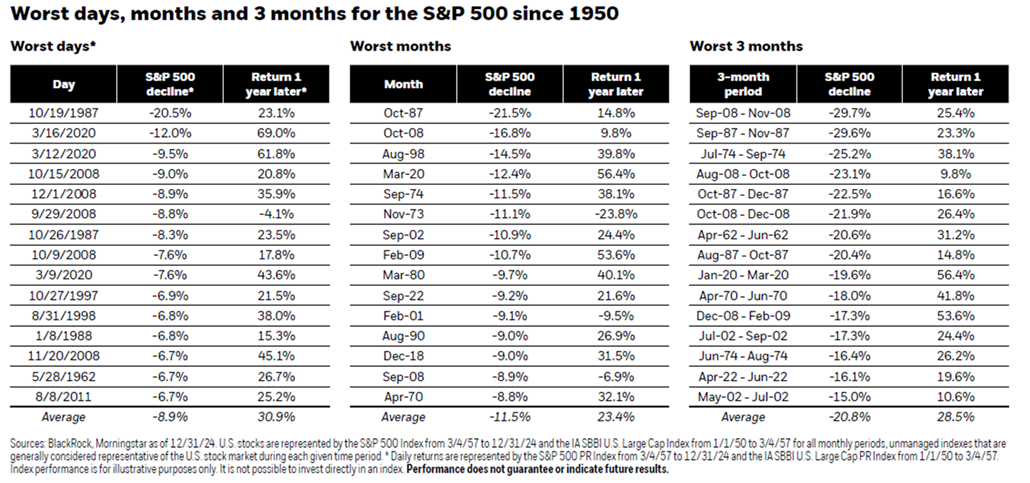
Stock market volatility is not a new concept, yet in the throes of down markets, it is common for investors to become emotional and feel the need to sell stocks in order to mitigate losses. As the chart below shows, following the worse days, months, or quarters for stocks, rebounds typically occur in the following months and years. Selling stocks that have already declined may allow you to feel better in the short-term but may cause you to miss a rebound. History has shown that a steady hand and patient approach to investing is a winning combination.
At Cambridge Trust Wealth Management, we have built diversified portfolios for clients across different asset classes, sectors, styles, and regions. Diversification offers multiple key benefits, including reduced risk by spreading investments across a number of different asset classes, smoothing out market volatility, and providing an element of protection from the impact of any single investment or asset classes underperformance. This certainly does not mean account values will not fall temporarily, but owning a blended mix of different stocks, along with bonds and cash can help provide more stability as we guide clients towards achieving their long-term financial goals.
1Source: Strategas Research Partners, Dan Clifton, April 3, 2025 and policyuncertainty.com
Cambridge Trust Wealth Management is a division of Eastern Bank. Views are as of April 2025 and are subject to change based on market conditions and other factors. The opinions expressed herein are those of the author(s), and do not necessarily reflect those of Eastern Bankshares, Inc., Eastern Bank or any affiliated entities. Views and opinions expressed are current as of the date appearing on this material; all views and opinions herein are subject to change without notice based on market conditions and other factors. These views and opinions should not be construed as a recommendation for any specific security or sector. This material is for your private information, and we are not soliciting any action based on it. The information in this report has been obtained from sources believed to be reliable but its accuracy is not guaranteed. There is neither representation nor warranty as to the accuracy of, nor liability for any decisions made based on such information. Past performance does not guarantee future performance.
Investment Products are not insured by the FDIC or any federal government agency, not deposits of or guaranteed by any bank, and may lose value.
Deposit products and related services are offered by Eastern Bank, Member FDIC. Residential lending is provided by Eastern Bank, an Equal Housing Lender.